- 标签
- 热门文章
- 推荐文章
Toad_ 分析金融数据提升生产力的工具
Toad — 分析金融数据提升生产力的工具
Toad的基本概念.
Toad是一个用于在金融场景下分析数据非常方便的库,我这篇是打算根据文档配上例子撸一遍.
Toad分为9个子模块.
toad.detecor module 精细版describe
toad.merge module 专门针对分箱
toad.metrics module Sklearn没有的偏金融模型评价指标
toad.plot module 作图模块
toad.scorecard module 直接做卡模块
toad.selection module 看函数是用于根据不同评价指标删除特征用的
toad.stats module 计算特征的熵,基尼系数等,iv,badrate等
toad.transform module Woe转换
toad.utils module 黑人问号?
Basic Tutorial For Toad
接下来跟着官方文档过一遍Toad的基本功能,使用的数据集可以在这里下载,例子分为五部分:
EDA
特征选择,WOE分箱
模型挑选
模型验证
分数变换
#!pip install --upgrade toad
import pandas as pd
import numpy as np
from sklearn.linear_model import LogisticRegression
from sklearn.model_selection import train_test_split
import toad # Our Main Character Today!
data = pd.read_csv('german_credit_data.csv')
data.drop('Unnamed: 0',axis=1,inplace=True)
data.replace({'good':0,'bad':1},inplace=True)

Xtr,Xts,Ytr,Yts = train_test_split(data.drop('Risk',axis=1),data['Risk'],test_size=0.25,random_state=450)
data_tr = pd.concat([Xtr,Ytr],axis=1)
data_tr['type'] = 'train'
data_ts = pd.concat([Xts,Yts],axis=1)
data['type'] = 'test'
print(data_tr.shape)
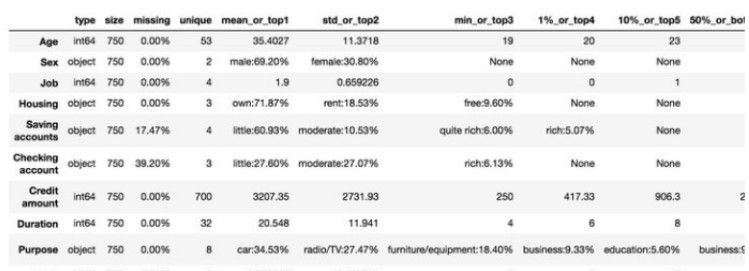
使用toad.detector.detect()来进行生成数据EDA报告
toad.detector.detect(data_tr).columns
Index(['type', 'size', 'missing', 'unique', 'mean_or_top1', 'std_or_top2',
'min_or_top3', '1%_or_top4', '10%_or_top5', '50%_or_bottom5',
'75%_or_bottom4', '90%_or_bottom3', '99%_or_bottom2', 'max_or_bottom1'],
dtype='object')
toad.detector.detect(data_tr)
特征选择,WOE变换
使用toad.selection.select()来根据特征缺失率,iv值,膨胀因子进行特征过滤
selected_data, drop_lst = toad.selection.select(
data_tr,target = 'Risk',empty = 0.5,
iv=0.05, corr=0.7,return_drop=True,exclude=['type']
)
selected_test = data_ts[selected_data.columns]
print(drop_lst)
{'empty': array([], dtype=float64), 'iv': array(['Sex', 'Job'], dtype=object), 'corr': array([], dtype=object)}
quality = toad.quality(data,'Risk')
quality.sort_values('iv',ascending=False)
使用Combiner()对象进行分箱合并
1、toad.transform.Combiner()可以用于对数值或分类型特征进行合并,toad支持卡方分箱,决策树分享,百分位分箱.
2、combiner().fit(data, y = ‘target’, method = ‘chi’, min_samples = None, n_bins = None**)分箱方法,method参数支持:‘chi’, ‘dt’, ‘percentile’, and ‘step’.
3、combiner().set_rules(dict): 用于确认分箱
4、combiner().transform(data): 将特征转换为确认的分箱
5、toad.transform.WOETransformer()对分享后的数据进行woe变换
6、WOETransformer().fir_transform(data,y_true,exlude=None) 数据的woe变换,exclude传入不需要转换的参数
7、WOETransformer().transform(data): 用已经建好的转换器转换测试,验证集
作图帮助调整分箱逻辑
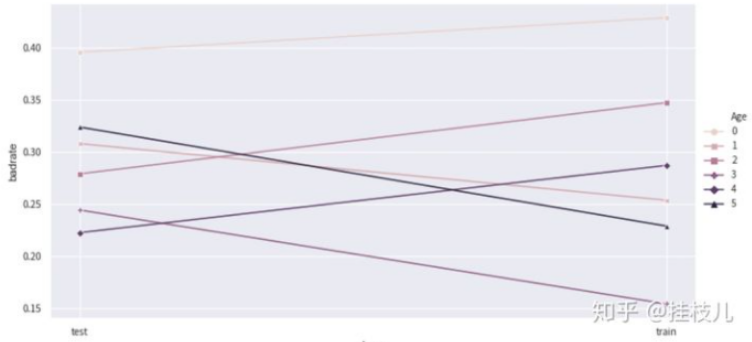
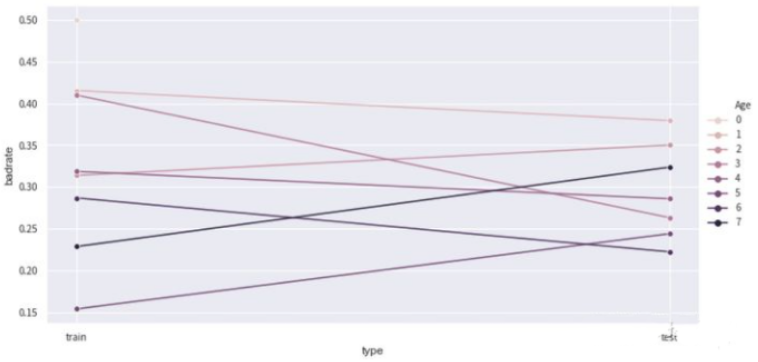
1、toad.plot.bad_rate_plot(data,target = ‘target’, x = None, by = None) 可视化每一箱在训练测试集的变换情况.
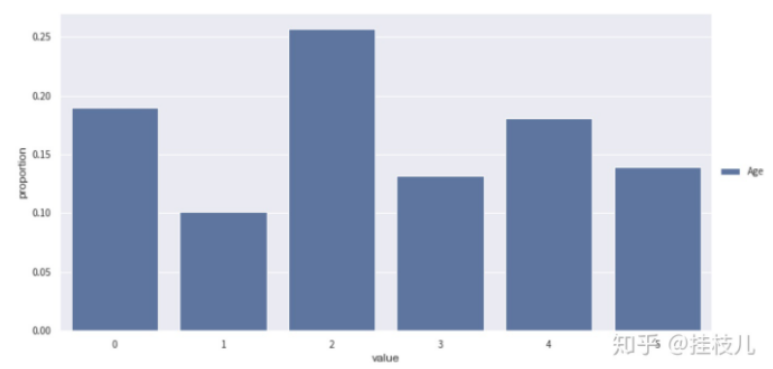
2、ad.plot.proportion_plot(data[col]): 显示每一箱在某个特征的占比
# 实例化一个combiner对象
combiner = toad.transform.Combiner()
# fit 并且确定分箱逻辑算法
combiner.fit(selected_data,y='Risk',method='chi',min_samples = 0.05, exclude = 'type')
# 保存分箱
bins = combiner.export()
bins
{'Age': [26, 28, 35, 39, 49],
'Housing': [['own'], ['free'], ['rent']],
'Saving accounts': [['nan'],
['rich'],
['quite rich'],
['little'],
['moderate']],
'Checking account': [['nan'], ['rich'], ['moderate'], ['little']],
'Credit amount': [2145, 3914],
'Duration': [9, 12, 18, 33],
'Purpose': [['domestic appliances', 'radio/TV'],
['car'],
['furniture/equipment', 'repairs', 'business'],
['education', 'vacation/others']]}
# 通过badrateplot更好的分箱
%matplotlib inline
adj_bin = {'Age': [26, 28, 35, 39, 49]}
c2 = toad.transform.Combiner()
c2.set_rules(adj_bin)
data_ = pd.concat([data_tr,data_ts],axis=0)
temp_data = c2.transform(data_[['Age',"Risk",'type']])
from toad.plot import badrate_plot,proportion_plot
badrate_plot(temp_data,target='Risk',x='type',by='Age')
proportion_plot(temp_data['Age'])
# 换个分箱看看
adj_bin = {'Age': [20,25, 28,30, 35, 39, 49]}
c2.set_rules(adj_bin)
temp_data = c2.transform(data_[['Age',"Risk",'type']])
badrate_plot(temp_data,target='Risk',x='type',by='Age')
# 确认后进行分箱
combiner.set_rules(adj_bin)
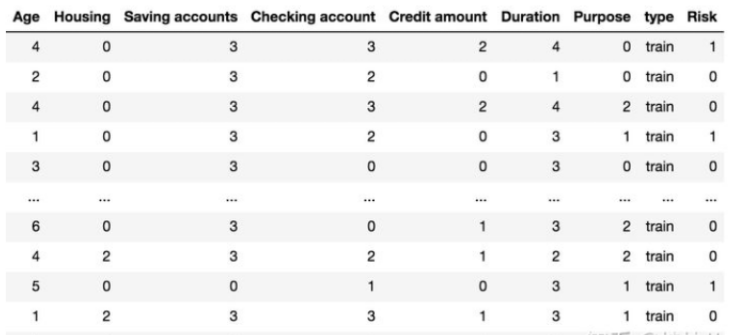
binned_data = combiner.transform(selected_data)
transer = toad.transform.WOETransformer()
data_tr_woe = transer.fit_transform(binned_data, binned_data['Risk'], exclude=['Risk','type'])
data_ts_woe = transer.transform(combiner.transform(selected_test))
# Now ready to model. Fit a lr.
Xtr = data_tr_woe.drop(['Risk','type'],axis=1)
Ytr = data_tr_woe['Risk']
Xts = data_ts_woe.drop(['Risk','type'],axis=1)
Yts = data_ts_woe['Risk']
lr = LogisticRegression()
lr.fit(Xtr, Ytr)
各种花式模型验证
支持ks,F1,auc等等
from toad.metrics import KS, F1, AUC
EYtr_proba = lr.predict_proba(Xtr)[:,1]
EYtr = lr.predict(Xtr)
print('Training error')
print('F1:', F1(EYtr_proba,Ytr))
print('KS:', KS(EYtr_proba,Ytr))
print('AUC:', AUC(EYtr_proba,Ytr))
EYts_proba = lr.predict_proba(Xts)[:,1]
EYts = lr.predict(Xts)
print('\nTest error')
print('F1:', F1(EYts_proba,Yts))
print('KS:', KS(EYts_proba,Yts))
print('AUC:', AUC(EYts_proba,Yts))
Training error
F1: 0.4540763673890609
KS: 0.45453626569857064
AUC: 0.7812139385618382
Test error
F1: 0.44720496894409933
KS: 0.46993266775017406
AUC: 0.7755978639424193
计算训练集和测试机的PSI
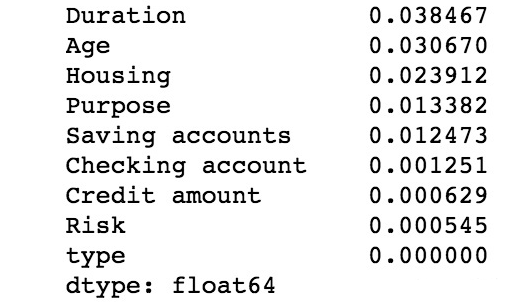
psi = toad.metrics.PSI(data_tr_woe,data_ts_woe)
psi.sort_values(0,ascending=False)
生成模型报告(这个我觉得做的也太贴心了吧)
tr_bucket = toad.metrics.KS_bucket(EYtr_proba,Ytr,bucket=10,method='quantile')
tr_bucket

进行评分卡分数变换
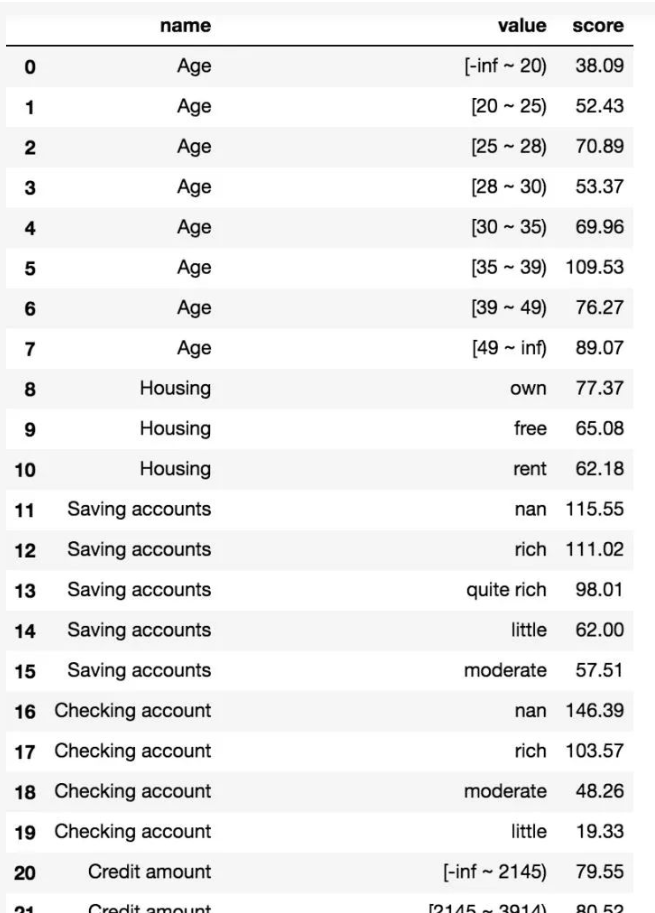
只需要确认分箱数,讲combiner和traner对象以及模型的超参数传入即可.同事能返回每个特征对应的分数
card = toad.scorecard.ScoreCard(combiner = combiner, transer = transer , C = 0.1)
card.fit(Xtr, Ytr)
card.export(to_frame = True,)
# Volia scorecard is done
pred_scores = card.predict(data_ts)
print('Sample scores:',pred_scores[:10])
print('Test KS: ',KS(pred_scores, data_ts['Risk']))
Sample scores: [588.39992196 473.34800722 657.21263451 498.44359981 577.26501354
604.90807613 615.34696972 502.9847795 590.77572458 530.03966734]
Test KS: 0.45468616980109905


 沪公网安备31011302006932号