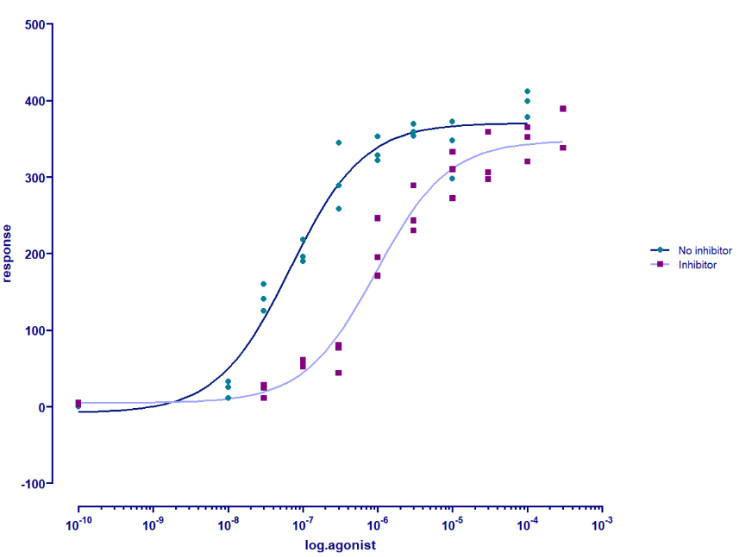
ggprism包官网给的教程中还有一个针对于GraphPad Prism示例图的绘制流程,感觉科研中还比较常用,在此记录分享一下
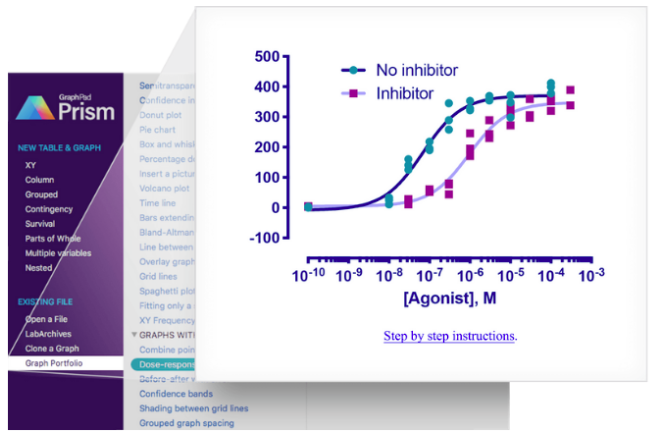
准备数据
# 加载R包
library(ggplot2)
library(ggprism)
library(ggnewscale)
library(dplyr)
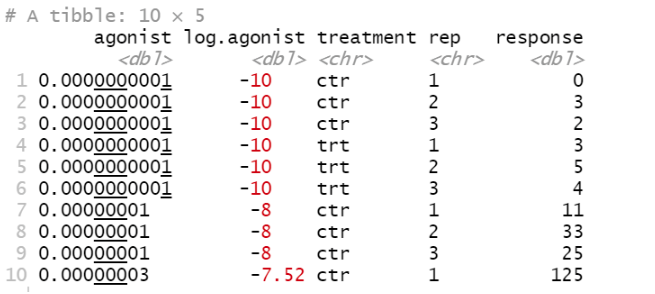
## 准备数据
df <- data.frame(
agonist = c(1e-10, 1e-8, 3e-8, 1e-7, 3e-7, 1e-6, 3e-6, 1e-5, 3e-5, 1e-4, 3e-4),
ctr1 = c(0, 11, 125, 190, 258, 322, 354, 348, NA, 412, NA),
ctr2 = c(3, 33, 141, 218, 289, 353, 359, 298, NA, 378, NA),
ctr3 = c(2, 25, 160, 196, 345, 328, 369, 372, NA, 399, NA),
trt1 = c(3, NA, 11, 52, 80, 171, 289, 272, 359, 352, 389),
trt2 = c(5, NA, 25, 55, 77, 195, 230, 333, 306, 320, 338),
trt3 = c(4, NA, 28, 61, 44, 246, 243, 310, 297, 365, NA)
) %>%
mutate(log.agonist = log10(agonist)) %>%
pivot_longer(
c(-agonist, -log.agonist),
names_pattern = "(.{3})([0-9])",
names_to = c("treatment", "rep"),
values_to = "response"
) %>%
filter(!is.na(response))
## 查看数据
head(df,10)
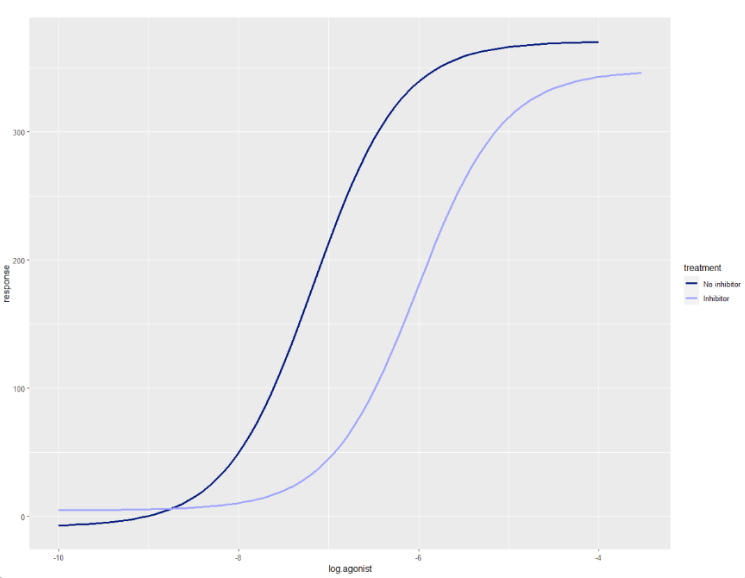
绘制基本图形
# plot the log10(agonist concentration) vs the response
p <- ggplot(df, aes(x = log.agonist, y = response))
# define model (note x and ec50 are swapped around because ec50 is already -ve)
dose_resp <- y ~ min + ((max - min) / (1 + exp(hill_coefficient * (ec50 - x))))
# 绘制两种类型的分布曲线
p <- p + geom_smooth(
aes(colour = treatment),
method = "nls", formula = dose_resp, se = FALSE,
method.args = list(start = list(min = 1.67, max = 397, ec50 = -7, hill_coefficient = 1))
)+ scale_colour_manual(
labels = c("No inhibitor", "Inhibitor"),
values = c("#00167B", "#9FA3FE")
)
p
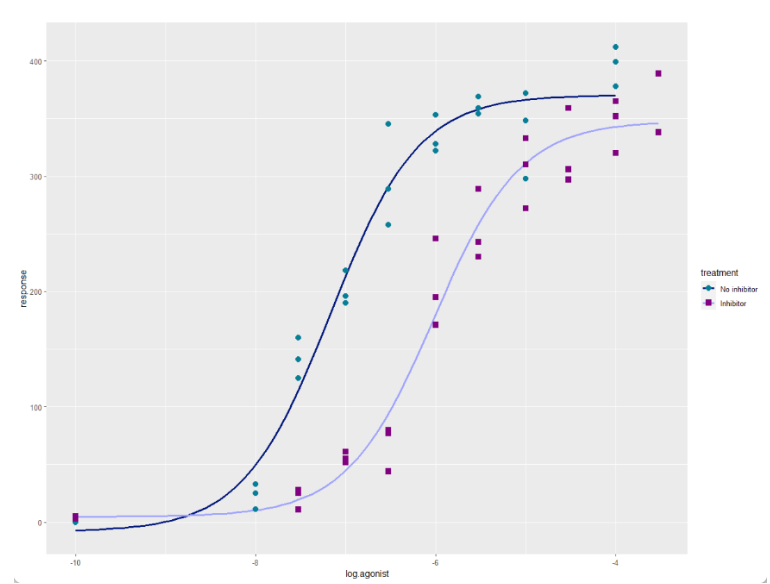
## 加上散点
p <- p + ggnewscale::new_scale_colour() +
geom_point(aes(colour = treatment, shape = treatment), size = 3) +
scale_colour_prism(
palette = "winter_bright",
labels = c("No inhibitor",
"Inhibitor")
) +
scale_shape_prism(
labels = c("No inhibitor",
"Inhibitor")
)
p
调整主题
优化X和Y坐标轴,添加主题
## 调整Y轴坐标
p <- p + theme_prism(palette = "winter_bright", base_size = 16)+ scale_y_continuous(
limits = c(-100, 500),
breaks = seq(-100, 500, 100),
guide = "prism_offset"
)
p
## 调整X轴坐标
p <- p + scale_x_continuous(
limits = c(-10, -3),
breaks = -10:-3,
guide = "prism_offset_minor",
minor_breaks = log10(rep(1:9, 7)*(10^rep(-10:-4, each = 9))),
labels = function(lab) {
do.call(
expression,
lapply(paste(lab), function(x) bquote(bold("10"^.(x))))
)
}
)
p
## 添加主题
p+ theme(
axis.title.y = element_blank(),
legend.title = element_blank(),
legend.position = c(0.05, 0.95),
legend.justification = c(0.05, 0.95)
) +
labs(x = "[Agonist], M")
p
上一条:用Graphpad完成单因素方差分析,并绘图
下一条:chemdraw2022_Win_中文_有机结构绘制_安装教程